

Survey on the Access to Finance of Enterprises: firms report lower interest rates amid reduced need for bank loans
14 April 2025
- Firms reported declining interest rates on bank loans, while indicating a slight further tightening of other lending conditions.
- The bank loan financing gap remained almost unchanged, with firms reporting a reduced need for such loans alongside a slight decrease in availability.
- Firms’ one-year-ahead median inflation expectations decreased slightly to 2.9%, down from 3%, while median inflation expectations three and five years ahead remained unchanged at 3.0%.
In the most recent round of the Survey on the Access to Finance of Enterprises (SAFE), covering the first quarter of 2025, euro area firms reported a net decrease in interest rates on bank loans (a net ‑12%, compared with a net ‑4% in the previous quarter), suggesting that monetary policy easing is being transmitted to firms. At the same time, a net 24% (a net 22% in the previous quarter) observed increases in other financing costs (i.e. charges, fees and commissions) (Chart 1).
In this survey round, firms indicated a reduction in the need for bank loans (net ‑4%, unchanged from the fourth quarter of 2024, Chart 2). At the same time, firms reported broadly stable availability of bank loans (a net ‑1%, down from a net 2% in the previous quarter). This left the bank loan financing gap – an index capturing the difference between the need for and the availability of bank loans – broadly unchanged (a net ‑1%, after a net 1% in the previous survey round). The current composite financing gap indicator – which includes bank loans, credit lines and trade credit as well as debt securities and equity – is reaching levels historically associated with periods of monetary policy easing. Looking ahead, firms expect a modest improvement in the availability of external financing over the next three months.
Firms continued to perceive the general economic outlook to be the main factor hampering the availability of external financing, as in the previous survey round (a net ‑21%, compared with a net ‑22%). A net 7% of firms indicated an improvement in banks’ willingness to lend (down from a net 8% in the previous survey round).
A net 6% of firms reported an increase in turnover over the last three months, unchanged from the previous survey round, with a significantly higher percentage of firms becoming optimistic about developments in the next quarter (a net 30%, up from a net 11%). More firms saw a deterioration in their profits compared with the previous survey round (a net ‑16%, down from ‑14% in the previous survey round). The survey indicates that the net percentage of firms reporting rising cost pressures had also increased over the past three months.
Firms’ expectations of selling prices over the next 12 months were unchanged, while expectations for wage costs slightly decreased, driven by lower expected pressures in the services sector (Chart 3). On average, firms’ selling price expectations remained unchanged at 2.9%, while the corresponding figure for wages was 3.0% (down from 3.3% in the previous round). At the same time, firms signalled a slight increase in other production costs (4%, up from 3.8% in the previous round).
Firms’ inflation expectations for the short term slightly decreased, while remaining unchanged at longer horizons (Chart 4). Median expectations for annual inflation one year ahead declined by 0.1 percentage point to 2.9%, while those for three and five years ahead saw no changes, standing at 3.0%. For inflation five years ahead, fewer firms reported balanced risks (30%, down from 33% in the previous round). A higher percentage of firms is seeing risks to the five-year-ahead inflation as being tilted to the upside (55%, up from 51% in the previous round), which was mirrored by a decline in the proportion of those perceiving risks to the downside (14%, down from 16%).
The report published today presents the main results of the 34th round of the SAFE survey for the euro area. The survey was conducted between 10 February and 21 March 2025. In this survey round, firms were asked about economic and financing developments over two different reference periods. Around half of firms were asked about changes in the period between October 2024 and March 2025. The remainder, all from the 12 largest euro area countries, were asked about changes in the period between January and March 2025. Additionally, firms also reported their expectations for euro area inflation, selling prices, and other costs. Altogether, the sample comprised 11,022 firms in the euro area, of which 10,167 (92%) had fewer than 250 employees.
For media queries, please contact Benoit Deeg tel.: +49 172 1683704.
Notes
Chart 1
Changes in the terms and conditions of bank financing for euro area firms
(net percentages of respondents)

Base: Firms that had applied for bank loans (including subsidised bank loans), credit lines, or bank or credit card overdrafts. The figures refer to rounds 27 to 34 of the survey (April-September 2022 to October 2024-March 2025).
Notes: Net percentages are the difference between the percentage of firms reporting an increase for a given factor and the percentage reporting a decrease. The data included in the chart refer to Question 10 of the survey. The grey panels represent responses for three-monthly reference periods, whereas the white panels relate to replies for six-monthly reference periods.
Chart 2
Changes in euro area firms’ financing needs and the availability of bank loans
(net percentages of respondents)

Base: Firms for which the instrument in question is relevant (i.e. they have used it or considered using it). Respondents replying “not applicable” or “don’t know” are excluded. The figures refer to rounds 27 to 34 of the survey (April-September 2022 to October 2024-March 2025).
Notes: The financing gap indicator combines both financing needs and the availability of bank loans at firm level. The indicator of the perceived change in the financing gap takes a value of 1 (-1) if the need increases (decreases) and availability decreases (increases). If firms perceive only a one-sided increase (decrease) in the financing gap, the variable is assigned a value of 0.5 (-0.5). A positive value for the indicator points to a widening of the financing gap. Values are multiplied by 100 to obtain weighted net balances in percentages. The data included in the chart refer to Questions 5 and Questions 9 of the survey. The grey panels represent responses for three-monthly reference periods, whereas the white panels relate to six-monthly reference periods.
Chart 3
Expectations for selling prices, wages, input costs and employees one year ahead, by size class
(percentage changes over the next 12 months)
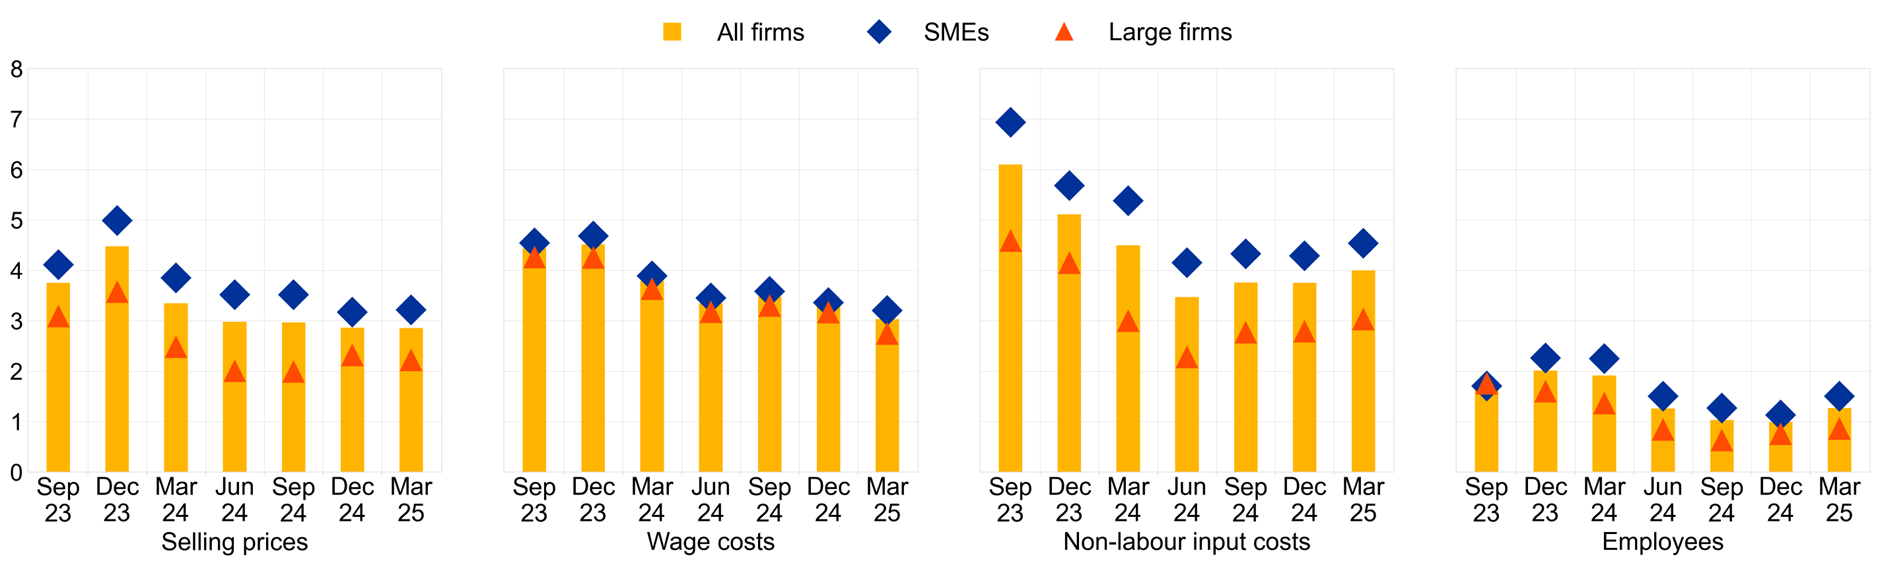
Base: All firms. The figures refer to rounds 29 to 34 (September 2023 to March 2025) of the survey, with firms’ replies collected in the last month of the respective survey waves.
Notes: Average euro area firms’ expectations of changes in selling prices, wages of current employees, non-labour input costs and number of employees for the next 12 months using survey weights. The statistics are computed after trimming the data at the country-specific 1st and 99th percentiles. The data included in the chart refer to Question 34 of the survey.
Chart 4
Firms’ median expectations for euro area inflation by size class
(annual percentages)

Base: All firms. The figures refer to pilot 2 and rounds 30 to 34 (December 2023 to March 2025) of the survey, with firms’ replies collected in the last month of the respective survey waves.
Notes: Median firms’ expectations for euro area inflation in one year, three years and five years, calculated using survey weights. The statistics are computed after trimming the data at the country-specific 1st and 99th percentiles. The data included in the chart refer to Question 31 of the survey.
Distribution channels: Banking, Finance & Investment Industry
Legal Disclaimer:
EIN Presswire provides this news content "as is" without warranty of any kind. We do not accept any responsibility or liability for the accuracy, content, images, videos, licenses, completeness, legality, or reliability of the information contained in this article. If you have any complaints or copyright issues related to this article, kindly contact the author above.
Submit your press release